| 
 FAQs by Category FAQs by Category
 Installation Guide Installation Guide
| 
| FAQ No.: | 00327 |
| Category: | Feature - Audit Trail |
|
| |  |
| Question: | How to display Audit Trail Log in Chart |
| |  |
| Answer: | After Curtain e-locker 5.0.3274.04, display audit trail log data in chart, perform statistical analysis on existing logs, and finally present them as visual chart, so that users can easily view and analyze log results.
Display Audit Trail Log in Chart:
1. In Curtain Admin -> File -> Audit Trail
2. Select the Audit Trail Logs you want to display in chart. (e.g. Client Audit Log)

3. Set the date range -> Audit Chart


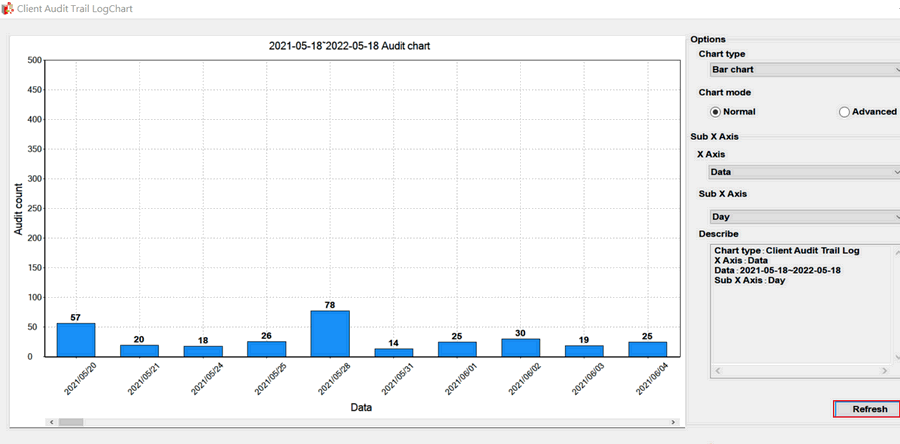
4.Click Refresh to show the chart

Option parameters:
- Chart type : There are 3 kinds of Chart - Bar Chart, Line Chart, Pie Chart
- Chart mode : There are 2 Chart modes
- Normal : Basically create chart with date of X Asia type and Sub X Axis type. (e.g.Data and Day, Users and All Users, Events and Appoint Events etc.)
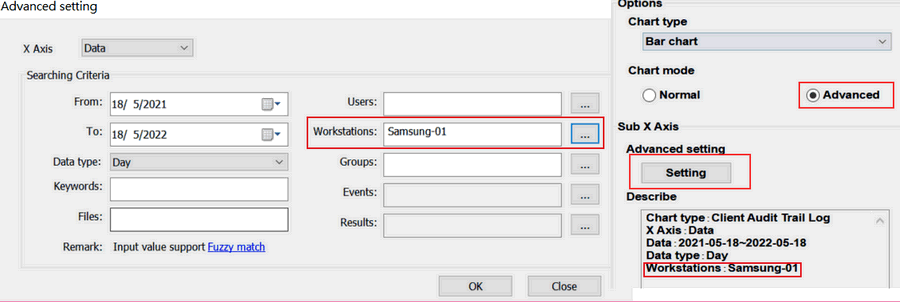
- Advanced : Based on Normal mode, full filter methods are used to create data into charts more accurately. (e.g. specific workstation name)

- X Axis : There are many information type
- Sub X Axis : Base on X Axis information, there are different information type for fitering
| X Axis | Sub X Axia | Client Aduit Trail Log | File Operation Aduit Trail Log | Administrator Aduit Trail Log |
| Data : Whole data | Date | √ | √ | √ |
| Month |
| Year |
| Users : Login user name | All Users | √ | √ | √ |
| Appoint Users |
| Workstations : Workstation name | All Workstations | √ | √ | |
| Appoint Workstations |
| Groups : Domain Group | All Groups | √ | | |
| Appoint Groups |
| Events : E-locker activities | All Events | √ | √ | √ |
| Appoint Events |
| Results : Success or Deny | All Results | √ | √ | √ |
| Appoint Results |
| Modules : Curtain Admin Module | All Modules | √ | √ | √ |
| Appoint Modules |
|
 |  |
 |  |
 |  |
 |  |
 |  |
|
 |  |
 | |
 |  |
 |  |
|
![]() FAQ
FAQ![]()